昨天,写了一篇关于圆环进度条的博客(请移步:Vue圆环进度条),已经烦不胜烦,今天又遇到了需要展示类似公司的组织结构图的功能需求,要冒了!!!
这种需求,自己用div+css也是可以实现的,但是没有什么动画效果,我的css3又很差劲,而且项目中已经使用到了折线图、饼状图、柱状图之类的图表,用的还是百度的echarts,所以这个组织结构图之类的需求也就用了百度的echarts来实现了。
以前用echarts写折线图、柱状图、饼状图的较多,它的API还算比较熟悉,但是画组织结构这样的树状图就很苦逼了,没用过啊,而且设计给的树状图的展示效果跟echarts树状图的展示效果相去甚远,我滴孩,又得一通费时费力的研究,设计图如下:
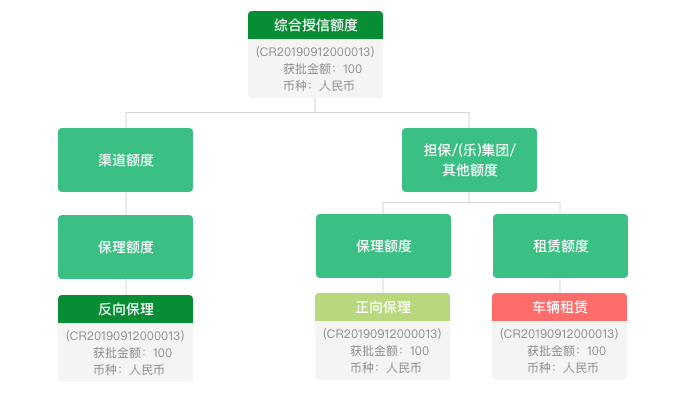
如图所示,一个树节点中可能会有两种不同的背景色,还有两种不同的文字颜色,每个节点展示的还是圆角矩形。有同学说了,echarts有设置圆角的API啊,直接设置不就完事了。我想说的是,它是提供的有这样的API,但是按照正常的套路实现不了啊。
从图上还可以看到一个几乎实现不了的效果,就是连接每个节点之间的线的拐角处都是直角而不是平滑的,而且echarts没有给出可以设置拐角处是直角的API,只是给了一个curveness(API的描述是树图边的曲度),这玩意儿使用了之后,也还是实现不了的。
从网上查了资料,有人说可以修改echarts的源码,这种解决办法我不推荐,是因为在vue或react项目中,echarts是需要通过安装在package.json中的,如果是多人并行开发,那么别人安装的echarts就不是你修改后的echarts,这就是问题所在。
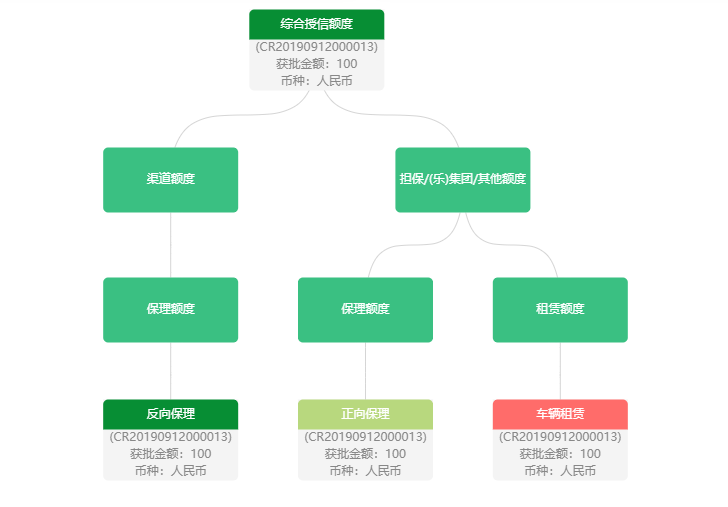
最后用echarts画出来的效果还是很不错的,唯一没有实现的就是连接每个节点的线的拐角处不是直角,有好的解决办法的,还望不吝赐教,谢谢!展示一下最终的成果:
说了那么多,还是上代码吧,该代码是基于vue的,如果要使用在react中,稍微修改一下就可以了。
组件tree.vue:
<template>
 <div :class="className" :style="{height:height,width:width}" />
</template>

<script>
import echarts from "echarts";
require("echarts/theme/macarons");
import { debounce } from "@/utils";

export default {
 props: {
  className: {
   type: String,
   default: "chart"
  },
  width: {
   type: String,
   default: "100%"
  },
  height: {
   type: String,
   default: "500px"
  },
  chartData: {
   type: Object,
   required: true
  }
 },
 data() {
  return {
   chart: null,
  };
 },
 watch: {
  chartData: {
   deep: true,
   handler(val) {
    this.setOptions(val);
   }
  }
 },
 mounted() {
  this.initChart();
  //是否需要自适应-加了防抖函数
  this.__resizeHandler = debounce(() => {
   if (this.chart) {
    this.chart.resize();
   }
  }, 100);
  window.addEventListener("resize", this.__resizeHandler);

  // 监听侧边栏的变化以实现自适应缩放
  const sidebarElm = document.getElementsByClassName("sidebar-container")[0];
  sidebarElm.addEventListener("transitionend", this.sidebarResizeHandler);
 },
 beforeDestroy() {
  if (!this.chart) {
   return;
  }
  window.removeEventListener("resize", this.__resizeHandler);
  this.chart.dispose();
  this.chart = null;

  const sidebarElm = document.getElementsByClassName("sidebar-container")[0];
  sidebarElm.removeEventListener("transitionend", this.sidebarResizeHandler);
 },
 methods: {
  initChart() {
   this.chart = echarts.init(this.$el, "macarons");
   this.setOptions(this.chartData);

   const nodes = this.chart._chartsViews[0]._data._graphicEls;
   let allNode = 0;
   for(let index = 0; index < nodes.length; index++) {
    const node = nodes[index];
    if (node === undefined) {
     continue
    }
    allNode++;
   }

   const height = window.innerHeight;
   const width = window.innerWidth - 1000;
   const currentHeight = 85 * allNode;
   const currentWidth = 220 * allNode;
   const newHeight = Math.max(currentHeight, height);
   const newWidth = Math.max(currentWidth, width);
   const tree_ele = this.$el;
   // tree_ele.style.height = newHeight + 'px'; //设置高度自适应
   tree_ele.style.width = newWidth + 'px';  //设置宽度自适应
   this.chart.resize();

   this.chart.on('click', this.chartData.clickCallback);  //节点点击事件
  },
  setOptions(data) {
   this.chart.setOption({
    //提供数据视图、还原、下载的工具
    // toolbox: {
    //  show : true,
    //  feature : {
    //   mark : {show: true},
    //   dataView : {show: true, readOnly: false},
    //   restore : {show: true},
    //   saveAsImage : {show: true}
    //  }
    // },
    series: [
     {
      name: "统一授信视图",
      type: "tree",
      orient: "TB", //竖向或水平  TB代表竖向 LR代表水平
      top: '10%',
      initialTreeDepth: 10, //树图初始展开的层级(深度)
      expandAndCollapse: false,  //点击节点时不收起子节点,default: true
      symbolSize: [135, 65],
      itemStyle: {
       color: 'transparent',
       borderWidth: 0,
      },
      lineStyle: {
       color: '#D5D5D5',
       width: 1,
       curveness: 1,
      },
      data: [data]
     }
    ]
   });
  },
  sidebarResizeHandler(e) {
   if (e.propertyName === "width") {
    this.__resizeHandler();
   }
  }
 }
};
</script>
使用tree.vue的方法:
<template>
  <tree :chartData="treeData" />
</template>

<script>
import tree from './tree';

export default {
 data() {
  return {
   treeData: {
    label: {
     backgroundColor: '#F4F4F4',
     borderRadius: [0, 0, 5, 5],
     formatter: [
      '{first|综合授信额度}',
      '{second|(CR20190912000013)\n获批金额:100\n币种:人民币}',
     ].join('\n'),
     rich: {
      first: {
       backgroundColor: '#078E34',
       color: '#fff',
       align: 'center',
       width: 135,
       height: 30,
       borderRadius: [5, 5, 0, 0],
      },
      second: {
       color: '#888',
       align: 'center',
       lineHeight: 17,
      },
     }
    },
    children: [
     {
      label: {
       formatter: [
        '{first|渠道额度}',
       ].join('\n'),
       rich: {
        first: {
         backgroundColor: '#3AC082',
         color: '#fff',
         align: 'center',
         width: 135,
         height: 65,
         borderRadius: 5,
        },
       }
      },
      children: [{
       label: {
        formatter: [
         '{first|保理额度}',
        ].join('\n'),
        rich: {
         first: {
          backgroundColor: '#3AC082',
          color: '#fff',
          align: 'center',
          width: 135,
          height: 65,
          borderRadius: 5,
         },
        }
       },
       children: [{
        label: {
         backgroundColor: '#F4F4F4',
         borderRadius: [0, 0, 5, 5],
         formatter: [
          '{first|反向保理}',
          '{second|(CR20190912000013)\n获批金额:100\n币种:人民币}',
         ].join('\n'),
         rich: {
          first: {
           backgroundColor: '#078E34',
           color: '#fff',
           align: 'center',
           width: 135,
           height: 30,
           borderRadius: [5, 5, 0, 0],
          },
          second: {
           color: '#888',
           align: 'center',
           lineHeight: 17,
          },
         }
        },
       }]
      }]
     },
     {
      label: {
       formatter: [
        '{first|担保/(乐)集团/其他额度}',
       ].join('\n'),
       rich: {
        first: {
         backgroundColor: '#3AC082',
         color: '#fff',
         align: 'center',
         width: 135,
         height: 65,
         borderRadius: 5,
        },
       }
      },
      children: [{
       label: {
        formatter: [
         '{first|保理额度}',
        ].join('\n'),
        rich: {
         first: {
          backgroundColor: '#3AC082',
          color: '#fff',
          align: 'center',
          width: 135,
          height: 65,
          borderRadius: 5,
         },
        }
       },
       children: [{
        label: {
         backgroundColor: '#F4F4F4',
         borderRadius: [0, 0, 5, 5],
         formatter: [
          '{first|正向保理}',
          '{second|(CR20190912000013)\n获批金额:100\n币种:人民币}',
         ].join('\n'),
         rich: {
          first: {
           backgroundColor: '#B8D87E',
           color: '#fff',
           align: 'center',
           width: 135,
           height: 30,
           borderRadius: [5, 5, 0, 0],
          },
          second: {
           color: '#888',
           align: 'center',
           lineHeight: 17,
          },
         }
        },
       }]
      },
      {
       label: {
        formatter: [
         '{first|租赁额度}',
        ].join('\n'),
        rich: {
         first: {
          backgroundColor: '#3AC082',
          color: '#fff',
          align: 'center',
          width: 135,
          height: 65,
          borderRadius: 5,
         },
        }
       },
       children: [
        {
         label: {
          backgroundColor: '#F4F4F4',
          borderRadius: [0, 0, 5, 5],
          formatter: [
           '{first|车辆租赁}',
           '{second|(CR20190912000013)\n获批金额:100\n币种:人民币}',
          ].join('\n'),
          rich: {
           first: {
            backgroundColor: '#FF6C6A',
            color: '#fff',
            align: 'center',
            width: 135,
            height: 30,
            borderRadius: [5, 5, 0, 0],
           },
           second: {
            color: '#888',
            align: 'center',
            lineHeight: 17,
           },
          }
         },
        },
       ]
      }]
     }
    ]
   }
  }
 },
 components: {
  tree,
 }
};
</script>
看着代码不多,但是实现起来,各种查echarts的API和网上的资料,而且,由于效果图中一个节点处的文字可能会换行,文字的颜色也不同,同时有些节点处的背景色还会有两种,以及每个节点处显示的样式和文字都是不固定的,所以我们可能还要面临着将接口返回的数据再改造处理成我们想要的数据的繁琐问题,就如同传递给树节点的treeData的格式一样,相当麻烦,如果每个节点的样式都是一样的,那就好办多了,如官网的一个树状图的例子:https://www.echartsjs.com/examples/zh/editor.html?c=tree-vertical
从echarts的v4.7.0版本开始,给配置项series中加入一个API:edgeShape:’polyline’可实现树形图表连接每个节点的线的拐角处呈直角。
以上就是vue使用echarts画组织结构图的详细内容,更多关于vue 画组织结构图的资料请关注NICE源码其它相关文章!