目录
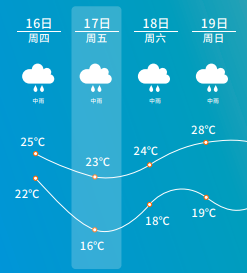
- UI设计图
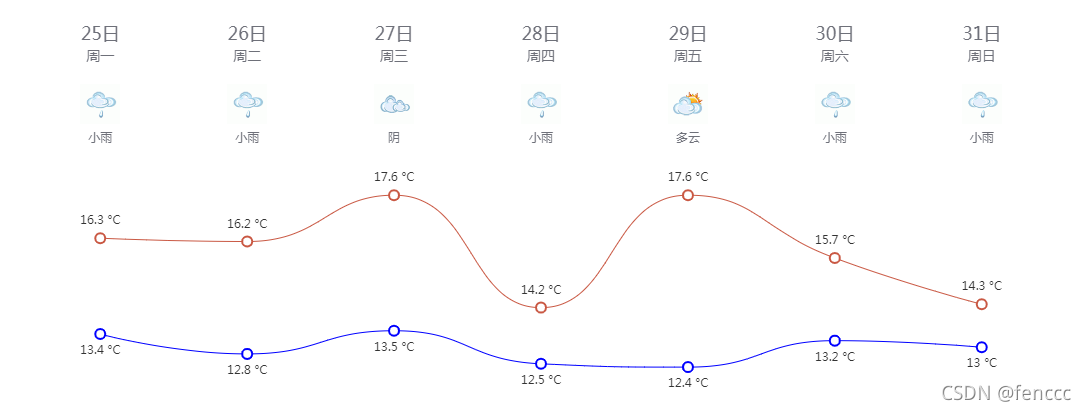
- Echarts示例效果
- 前言
- 示例代码
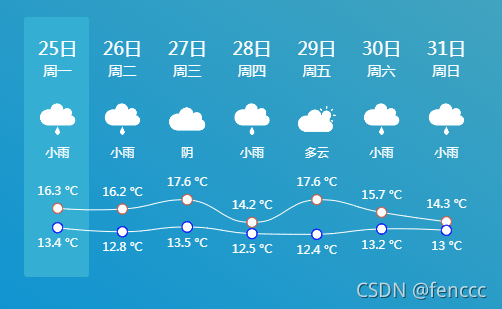
- 最终效果
UI设计图
Echarts示例效果
前言
对于UI给出的设计图,各个气象网站都有类似的效果,实现方式大可归为两种:
- 网格布局+图表框架绘制温度曲线;
- 网格布局+canvas自绘温度曲线;
这两种实现方式的共同点都是将曲线和上面的描述文字拆分开来,这样做难点是要实现日期图标部分和气温曲线部分的自适应对齐。因为我CSS经验相对比较薄弱,并且使用Echarts图表框架相对较多,所以决定尝试使用Echarts(版本:4.6.0)来实现上面的效果。查看文档后发现Echarts支持多X轴和富文本显示,可以通过调整X轴偏移量来控制显示位置,同时富文本支持设置背景图标,可以用来显示天气图标。一番测试后得到下面的示例代码。
示例代码
下面这段代码可以考入Echarts直接运行:
var option = {
        grid: {
          show: true,
          backgroundColor: 'transparent',
          opacity: 0.3,
          borderWidth: '0',
          top: '180',
          bottom: '0'
        },
        tooltip: {
          trigger: 'axis'
        },
        legend: {
          show: false
        },
        xAxis: [
          // 日期
          {
            type: 'category',
            boundaryGap: false,
            position: 'top',
            offset: 130,
            zlevel: 100,
            axisLine: {
              show: false
            },
            axisTick: {
              show: false
            },
            axisLabel: {
              interval: 0,
              formatter: [
                '{a|{value}}'
              ].join('\n'),
              rich: {
                a: {
                  // color: 'white',
                  fontSize: 18
                }
              }
            },
            nameTextStyle: {

            },
            data: ["25日","26日","27日","28日","29日","30日","31日"]
          },
          // 星期
          {
            type: 'category',
            boundaryGap: false,
            position: 'top',
            offset: 110,
            zlevel: 100,
            axisLine: {
              show: false
            },
            axisTick: {
              show: false
            },
            axisLabel: {
              interval: 0,
              formatter: [
                '{a|{value}}'
              ].join('\n'),
              rich: {
                a: {
                  // color: 'white',
                  fontSize: 14
                }
              }
            },
            nameTextStyle: {
              fontWeight: 'bold',
              fontSize: 19
            },
            data: ["周一","周二","周三","周四","周五","周六","周日"]
          },
          // 天气图标
          {
            type: 'category',
            boundaryGap: false,
            position: 'top',
            offset: 20,
            zlevel: 100,
            axisLine: {
              show: false
            },
            axisTick: {
              show: false
            },
            axisLabel: {
              interval: 0,
              formatter: function(value, index) {
                return '{' + index + '| }\n{b|' + value + '}'
              },
              rich: {
                0: {
                  backgroundColor: {
                    // image: require('@/assets/weather_icon/' + this.weatherIconDic[this.weatherdata.weather[0]] + '.png')
                    image: 'https://d.scggqx.com/forecast/img/小雨.png'
                  },
                  height: 40,
                  width: 40
                },
                1: {
                  backgroundColor: {
                    // image: require('@/assets/weather_icon/' + this.weatherIconDic[this.weatherdata.weather[1]] + '.png')
                    image: 'https://d.scggqx.com/forecast/img/小雨.png'
                  },
                  height: 40,
                  width: 40
                },
                2: {
                  backgroundColor: {
                    // image: require('@/assets/weather_icon/' + this.weatherIconDic[this.weatherdata.weather[2]] + '.png')
                    image: 'https://d.scggqx.com/forecast/img/阴.png'
                  },
                  height: 40,
                  width: 40
                },
                3: {
                  backgroundColor: {
                    // image: require('@/assets/weather_icon/' + this.weatherIconDic[this.weatherdata.weather[3]] + '.png')
                    image: 'https://d.scggqx.com/forecast/img/小雨.png'
                  },
                  height: 40,
                  width: 40
                },
                4: {
                  backgroundColor: {
                    // image: require('@/assets/weather_icon/' + this.weatherIconDic[this.weatherdata.weather[4]] + '.png')
                    image: 'https://d.scggqx.com/forecast/img/多云.png'
                  },
                  height: 40,
                  width: 40
                },
                5: {
                  backgroundColor: {
                    // image: require('@/assets/weather_icon/' + this.weatherIconDic[this.weatherdata.weather[5]] + '.png')
                    image: 'https://d.scggqx.com/forecast/img/小雨.png'
                  },
                  height: 40,
                  width: 40
                },
                6: {
                  backgroundColor: {
                    // image: require('@/assets/weather_icon/' + this.weatherIconDic[this.weatherdata.weather[6]] + '.png')
                    image: 'https://d.scggqx.com/forecast/img/小雨.png'
                  },
                  height: 40,
                  width: 40
                },
                b: {
                  // color: 'white',
                  fontSize: 12,
                  lineHeight: 30,
                  height: 20
                }
              }
            },
            nameTextStyle: {
              fontWeight: 'bold',
              fontSize: 19
            },
            // data: this.weatherdata.weather
            data: ["小雨","小雨","阴","小雨","多云","小雨","小雨"]
          }
        ],
        yAxis: {
          type: 'value',
          show: false,
          axisLabel: {
            formatter: '{value} °C',
            color: 'white'
          }
        },
        series: [
          {
            name: '最高气温',
            type: 'line',
            data: ["16.3","16.2","17.6","14.2","17.6","15.7","14.3"],
            symbol: 'emptyCircle',
            symbolSize: 10,
            showSymbol: true,
            smooth: true,
            itemStyle: {
              normal: {
                color: '#C95843'
              }
            },
            label: {
              show: true,
              position: 'top',
              // color: 'white',
              formatter: '{c} °C'
            },
            lineStyle: {
              width: 1,
              // color: 'white'
            },
            areaStyle: {
              opacity: 1,
              color: 'transparent'
            }
          },
          {
            name: '最低气温',
            type: 'line',
            data: ["13.4","12.8","13.5","12.5","12.4","13.2","13"],
            symbol: 'emptyCircle',
            symbolSize: 10,
            showSymbol: true,
            smooth: true,
            itemStyle: {
              normal: {
                color: 'blue'
              }
            },
            label: {
              show: true,
              position: 'bottom',
              // color: 'white',
              formatter: '{c} °C'
            },
            lineStyle: {
              width: 1,
              // color: 'white'
            },
            areaStyle: {
              opacity: 1,
              color: 'transparent'
            }
          }
        ]
      }
上面的代码,最难的部分就是天气图标的设置,由于axisLabel的formatter方法中的value值没法在富文本中使用,所以这里在formatter方法中将value的下标设置成了富文本中的css名,然后在设置天气图标时使用下标获取需要显示的图标名称。
// axisLabel的formatter方法
formatter: function(value, index) {
 return '{' + index + '| }\n{b|' + value + '}'
}

// axisLabel的rich方法
rich: {
	index: {
	     backgroundColor: {
	       image: require('@/assets/weather_icon/' + this.weatherIconDic[this.weatherdata.weather[index]] + '.png')
	     },
	     height: 40,
	     width: 40
	   }
   }
注:
1、this.weatherIconDic是我本地定义的一个天气图标的数据字典。(如:{ ‘晴’: ‘a00′, ‘多云’: ‘a01′, ‘阴’: ‘a02′, ‘阵雨’: ‘a03′, ‘雷阵雨’: ‘a04′, ‘冰雹’: ‘a05′, ‘雨夹雪’: ‘a06′, ‘小雨’: ‘a07′, ‘中雨’: ‘a08′, ‘大雨’: ‘a09′, ‘暴雨’: ‘a10′, ‘大暴雨’: ‘a11′, ‘特大暴雨’: ‘a12′, ‘阵雪’: ‘a13′, ‘小雪’: ‘a14′, ‘中雪’: ‘a15′, ‘大雪’: ‘a16′, ‘暴雪’: ‘a17′, ‘雾’: ‘a18′, ‘冻雨’: ‘a19′, ‘沙尘暴’: ‘a20′, ‘小到中雨’: ‘a21′, ‘中雨-大雨’: ‘a22′, ‘大雨-暴雨’: ‘a23′, ‘暴雨-大暴雨’: ‘a24′, ‘大暴雨-特大暴雨’: ‘a25′, ‘小雪-中雪’: ‘a26′, ‘中雪-大雪’: ‘a27′, ‘大雪-暴雪’: ‘a28′, ‘浮尘’: ‘a29′, ‘扬沙’: ‘a30′, ‘强沙尘暴’: ‘a31′ })
2、this.weatherdata.weather是后端传回来的天气类型。(如:[“小雨”,“小雨”,“阴”,“小雨”,“多云”,“小雨”,“小雨”])
最终效果
到此这篇关于Echarts利用多X轴实现七天天气预报效果的示例代码的文章就介绍到这了,更多相关Echarts 多X轴天气预报内容请搜索NICE源码以前的文章或继续浏览下面的相关文章希望大家以后多多支持NICE源码!